The DevSecOps approach is intended to ensure that security is built into the entire lifecycle of an application and that the responsibility for security is shared among different teams. Currently though, most government agencies split responsibility for IT between application, operations, security, and program management teams. Addressing the siloed security operations and maturing DevSecOps practices is an important element of meeting cybersecurity challenges every organization faces today.
Leveraging an off-the-shelf visualization tool that almost every government agency owns (Microsoft Power BI), TCG created a low-cost security dashboard to help agencies’ IT teams obtain a clear and comprehensive view of a security environment and track progress on remediation efforts. This is an essential aspect of maturing DevSecOps practices because transparency and sharing data efficiently allows responsibility for security issues to be routed to stakeholders that can act quickly upon it instead of remaining within a single team. The tool has helped the United States International Trade Commission (USITC) share information and responsibility for resolving security vulnerabilities across the organization, key priorities for the USITC OCIO.
Challenge
Daily security scans produce large volumes of data, usually in CSV files, making fragile spreadsheets a default approach for reporting and tracking information on vulnerabilities. While commercial tools are available to consolidate all of this information, they are often costly and difficult to install in government without significant overhead. Without these tools, the raw data from security scans is unwieldy and time consuming to structure and communicate, resulting in a remediation process that is slow and disjointed. This leads to several problems:
- Stakeholders are delayed in discovering key vulnerabilities
- The responsible individual from each division or department must pore over all of the data with little ability to filter out what is irrelevant to their group.
- Gaining an accurate global picture of vulnerabilities across the organization and what actions have been taken to address them is difficult when tracking vulnerabilities.
- The history of vulnerabilities and remediation efforts can be buried across daily reports.
Tenable, the market leader in security vulnerability scanning, provides dashboards for reporting security vulnerabilities and tracking remediation efforts. However, it requires each individual accessing them to have their own license. This means that creating transparency throughout the organization around security risks is costly, or that organizations must sacrifice transparency because they cannot afford the licenses for these tools.
Solution
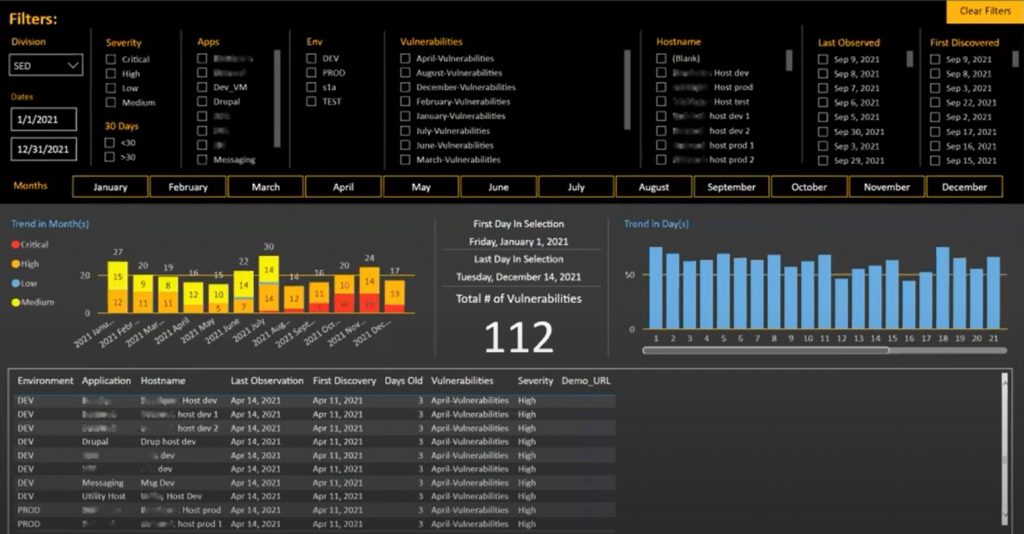
The Security Vulnerability Dashboard created by TCG pulls data from the security monitoring software used by the agency, and structures the data so that those responsible can quickly identify and take action on vulnerabilities. The dashboard features:
- Automated updating and syncing of information. The dashboard is updated in real-time.
- Customizable mapping and filtering. Filter vulnerabilities based on the division responsible for them and mapped according to hostnames and the applications they affect.
- Clear visualizations of vulnerabilities. Track vulnerability trends and identify recurring issues.
- View the entire history of vulnerabilities and remediation efforts. Access and display data for the date range you set.
Information is shared with those responsible for taking action without requiring additional software licenses. Agencies are also able to retain results longer than 6 months (a constraint of the commercial option setup) which the OCIO can use to report on the agency’s progress.
The dashboard provided USITC management a visualization of the raw excel data received daily. Through a datafile provided in Sharepoint, the dashboard automatically imported the daily vulnerability reports, which were previously limited to spreadsheets.

*Data has been redacted for security purposes
Results
TCG’s Security Vulnerability Dashboard provided an overarching view that enabled identification of recurring issues, collaborative monitoring of progress, and planning for continued improvements. This resulted in increased transparency across staff and management, and due to better sharing of security data, helped ensure security was a shared responsibility. In short, it has helped elevate the agency’s DevOps practice into DevSecOps. With the insights gained by quantifying and reporting on trends and efforts, agencies will be better equipped to make data-driven security decisions.
TCG’s client agency reported the following results:
- Granted dashboard access for everyone who needed information on security vulnerabilities without additional licenses
- Eliminated work in gathering reports, exporting to excel, organizing, sorting through several hundreds of lines to see which vulnerabilities specific parties were responsible.
- Gave the ability to visualize and prioritize the current security vulnerabilities
- Facilitated collaboration by making it easy to identify and bring together teams to resolve the outstanding vulnerabilities
- Created a new function that doesn’t exist in the current paid service/product by giving the agency a historical overview of the vulnerabilities
- Provided an easy way to report on the remediation progress
- Provided management a clear overview of the risk environment related to security scans
This dashboard originated to meet the needs of a specific team in the organization to effectively structure the vulnerability data they received from daily Tenable scans, a leading provider of cybersecurity software. But, because the dashboard could be easily shared and had the ability to filter information relevant for different stakeholders, it is now used throughout the organization.