by Dr. Robert Buccigrossi, TCG CTO
Piquing My Interest – When I read the title “How to replace estimations and guesses with a Monte Carlo simulation”, I got really excited: Of course I would love to learn how to avoid project estimation! While the article is interesting, the example was rather simplistic. It assumed that you didn’t differentiate at all between the tasks. But, it inspired me to search and find “Monte Carlo forecasting in Scrum” (scrum.org) and “Monte Carlo Forecasting in Software Delivery” (medium.com).
A Real-World Problem – So let’s say you do tee-shirt sizing of your backlog. If you record how long backlog items really took (useful to calculate velocity), over time you’ll end up with a record of “small” times, “medium” times, “large” times, etc. Of course, you can use that historical data to estimate how many backlog items can fit in a new sprint. But if we use the average for each shirt size, there’s a very good chance (50% if our error is symmetric) that we’ll have too many items and we’ll go over. As a result, we typically add padding to every sprint. But could we be more accurate? Could we figure out the number of items that we can do with say 95% confidence?
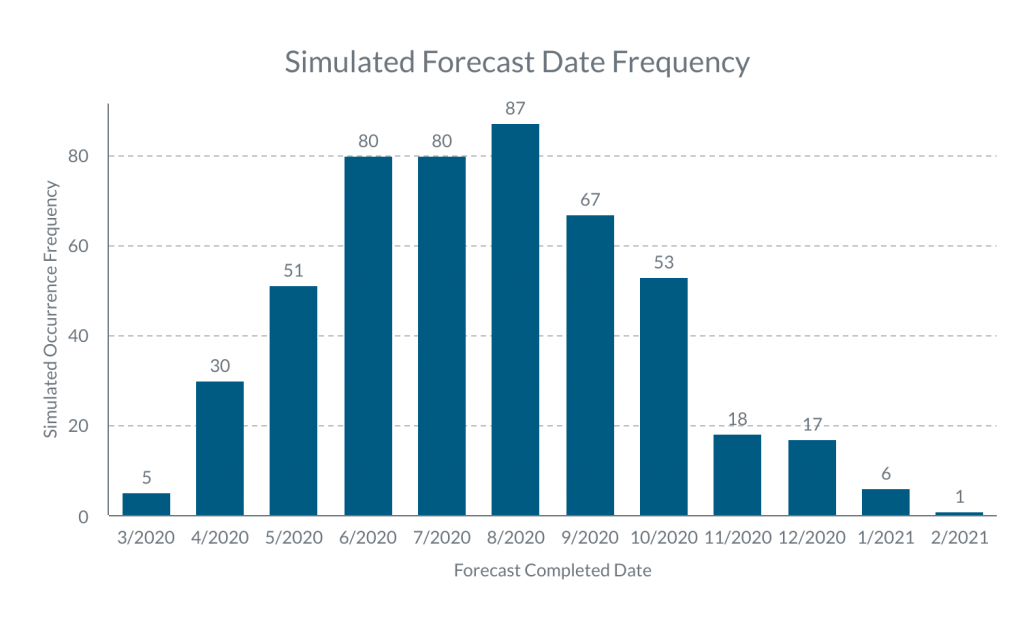
Monte Carlo is More Than a Casino – While the phrase “Monte Carlo simulation” may sound impressive, it’s isn’t that hard conceptually. Let’s say we had 10 small, 5 medium, and 1 large ticket planned for our sprint. To run a single Monte Carlo simulation step, you randomly grab 10 small tickets, 5 medium tickets, and 1 large ticket from our past and ask “How long did they take combined?” As you would imagine, the answer greatly varies depending upon the tickets you randomly grabbed. The magic of a Monte Carlo simulation is to repeat that random step thousands of times, collect the answers, and look at the distribution (like the example below):

If we take the average of the distribution, we’ll end up with the same answer as if we used the average shirt-sizes normally (so no special magic there.) But, armed with the distribution we can ask different questions, such as: “What’s the chance that we’ll finish by 10/20?” or “By what day will we have a 95% chance of finishing?” Through Monte Carlo simulation, we are able to estimate the complex probability distributions that hide in our historical data and use them to answer some interesting questions!
Thanks to Monte Carlo, we can help our projects answer interesting questions from our historical ticket data!